My first year trying better ways to earn through crypto comes to an end in under 2 weeks (on 31 March, but 29 March is the closest Sunday), so I’ve been looking back at the year, at the losses, at the gains, at… how I don’t have any easy way to see what’s gaining and what isn’t. 😲
Sure, I have my weekly numbers all neatly stored in Excel, with percentages and blah blah blah, but I don’t have a visual aid to really see how things are going.
I don’t even have a specific yearly target!
I’m kinda obsessive about tracking, as you may have noticed, so I dug out the stuff I made for the 1% trading setup and had a think.
The goal when I started was to double my investment each year. That’s a good goal for now, but I’ll expand it to doubling each category of my investment.
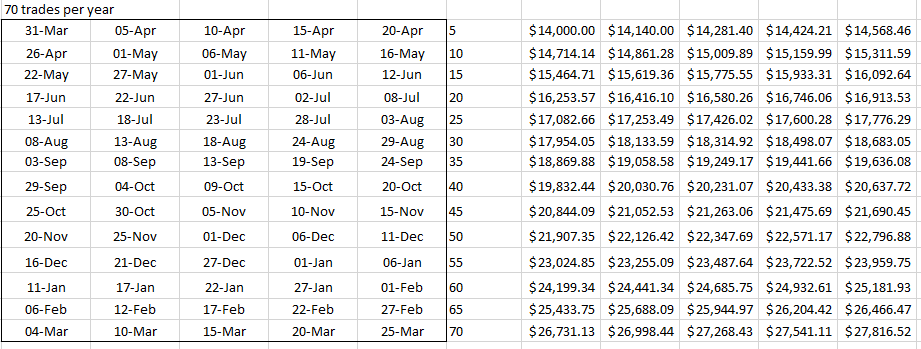
Doing 1% trades and compounding the earnings, doubling needs about 70 trades in a year, depending on rounding errors.
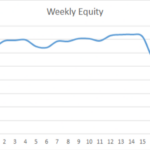
My original tracking followed the 1% increase every 1/70th of a year (5 days and change), with dates going green when achieved or red when missed.
It looked like this:
I figure I’ll use that again, so I replicated it 4 times:
- One for Trading (total)
- One for Copy Trading
- One for Banking (total)
- One for Dual Investment (because I hope it’ll gain massively)
It looks like this (the $ numbers are also replicated 4 times, off to the right, out of sight):
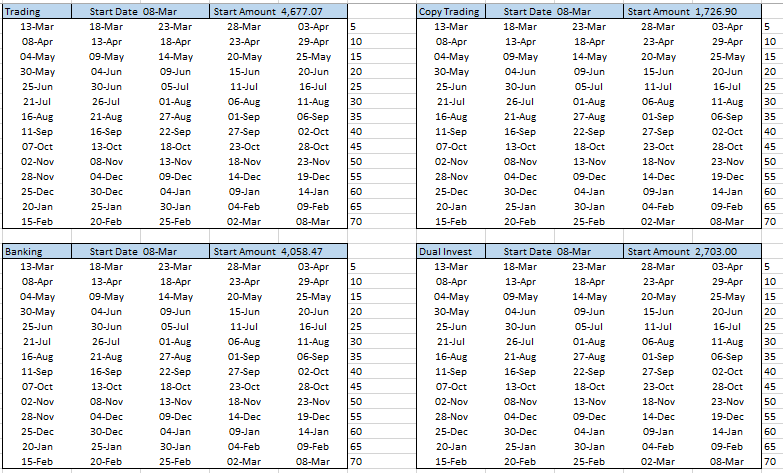
In Excel
Setting up the dates and $ numbers is easy.
Only the 1st date and $ entries are fixed. The others are all calculated from them, so you can easily change the start date/amount and have everything re-figure itself.
The $ increases are “=previous cell * 1.01”, the dates to hit are “= previous cell + (365/70)”.
Getting the cells to change colour is the tough bit, mostly because Excel’s conditional formatting is bizarrely counter-intuitive (i.e. built really badly).
You need 2 rules for each cell (though you only build them once and tell it to apply the same rule to the whole block).
The red rule checks that the number in the $ block is bigger than the current amount (i.e. you haven’t hit the target) and that TODAY() is greater than the date in the date block.
So that’s “=AND(number > $current, TODAY() > date)” – don’t forget the “current” value will be an absolute address, so it’s always the same cell.
The green rule checks that the number in the $ block is less than or equal to the current amount. You can do that one with the rule builder, but don’t forget to make the current amount an absolute address again.
And that’s it. As the totals change, the trackers update with green/red signals!
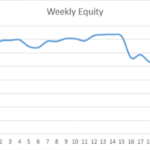
This Week’s Tracking
We have to check that it works, of course, so here’s this week’s tracking (based on Sunday’s numbers) with a lot of lovely greens.
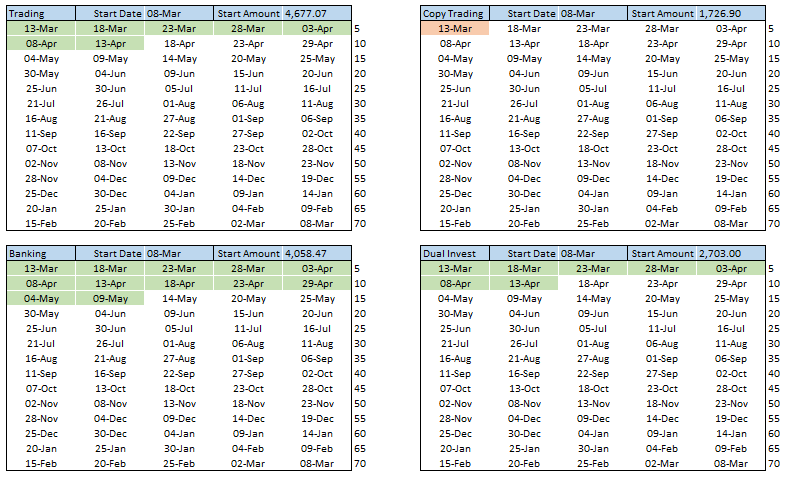
Both Banking and Trading would be well ahead of schedule to double, as you can see by future dates going green. And boo, copy trading sucks!
I’ll set up the start dates and numbers when the new year starts, on 29 March. I’ll update my original 1% tracking to match, as well – might as well have the big total, starting at my original $14,000, to see if I can push through the negative and double it!
Do you use any visual aids for tracking? I’d love to see or hear about them!